Abstract
In today’s fast-paced digital ecosystem, building a successful product goes beyond innovation; it demands measurable impact. Key Performance Indicators (KPIs) serve as the backbone of product evaluation, offering critical insights into user behaviour, market traction, and business growth. This white paper explores the role of KPIs in product management, key elements of performance metrics, practical strategies for implementation, the benefits of effective KPI tracking, real-world success stories, and common challenges faced by organisations when aligning metrics with product goals.
Introduction
Achieving excellence in developing products requires evaluation, not conjecture. KPIs, or Key Performance Indicators, allow product teams to quantify the effectiveness of their efforts and make data-informed decisions. These metrics act as guiding stars, enabling teams to understand whether they are moving in the right direction.
These indicators are strategic, results-driven, and deeply integrated with a company’s mission and priorities. Whether measuring user engagement, retention, or revenue, the right KPIs enable teams to focus their resources on what truly matters: delivering consistent value to users and stakeholders. Effective use of KPIs requires not only knowing which metrics to track but also understanding when and how to apply them across different stages of the product life cycle.
Key Elements of Product KPIs
- User Acquisition Metrics: They reflect the efficiency with which a product captures new user interest.
- Customer Acquisition Cost (CAC): The entire amount spent on sales and marketing to acquire a single new client.
- Conversion Rate: The proportion of visitors who complete a desired action, like registering or buying something, is essential for return on investment.
- Traffic Source Attribution: Tracks which channels (organic, paid, referral) are driving user growth.
- Engagement Metrics
- They reflect both the level of user activity, and the value derived from product usage.
- Daily/Monthly Active Users (DAU/MAU): Shows user frequency and stickiness.
- Session Length & Frequency: Measures how long and how often users engage.
- Feature Usage: Evaluates adoption of specific features to guide development priorities.
- Retention & Churn Metrics
- Long-term success depends on whether users return to the product consistently.
- User Retention Rate: Measures the proportion of users who keep using the product over a specific period, indicating long-term engagement.
- Churn Rate: Represents the percentage of users who discontinue using the product within a defined timeframe, highlighting potential issues with retention.
- Cohort Analysis: Evaluates the behaviour and lifecycle of user groups segmented by their sign-up date, helping to identify trends and patterns in retention and engagement over time.
- Monetization Metrics
- These indicators measure how well the product generates revenue.
- Monthly Recurring Revenue (MRR): The expected total earnings from active subscribers during a given month
- Customer Lifetime Value (LTV): Total revenue expected from a user over their lifecycle.
- ARPU (Average Revenue per User): Gauges revenue efficiency per user.
- Operational Metrics
- These focus on the internal efficiency of building and supporting the product.
- Release Cycle Time: Time taken from ideation to product deployment.
- Bug Fix Time: How quickly issues are resolved post-identification.
- Support Ticket Volume: Measures post-launch user issues, indicating usability or reliability gaps.
Strategies for Implementing KPIs
To use KPIs effectively in product management, teams should adopt the following strategies:
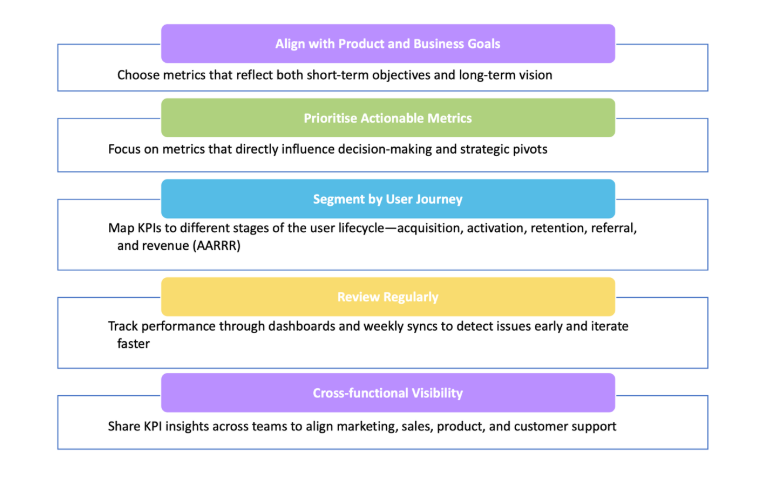
- Align with Product and Business Goals: Choose metrics that reflect both short-term objectives and long-term vision.
- Prioritise Actionable Metrics: Focus on metrics that directly influence decision-making and strategic pivots.
- Segment by User Journey: Map KPIs to different stages of the user lifecycle—acquisition, activation, retention, referral, and revenue (AARRR).
- Review Regularly: Track performance through dashboards and weekly syncs to detect issues early and iterate faster.
- Cross-functional Visibility: Share KPI insights across teams to align marketing, sales, product, and customer support.
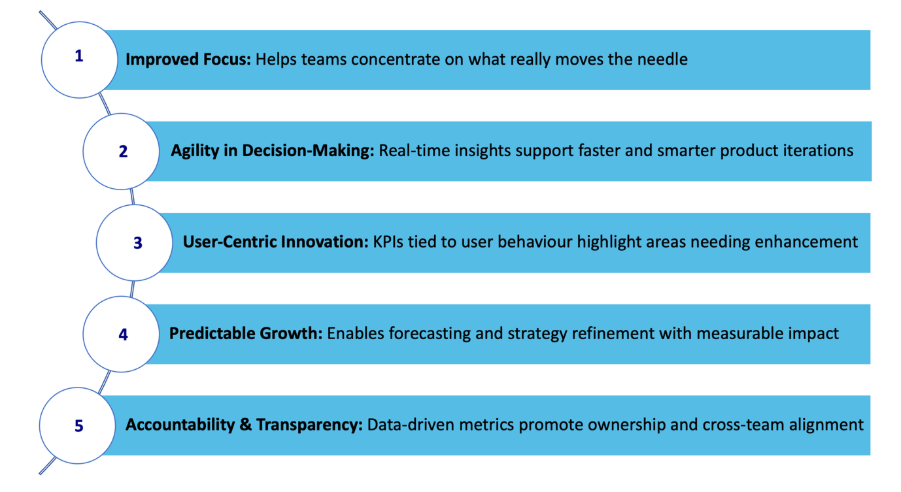
- Improved Focus: Helps teams concentrate on what really moves the needle.
- Agility in Decision-Making: Real-time insights support faster and smarter product iterations.
- User-Centric Innovation: KPIs tied to user behaviour highlight areas needing enhancement.
- Predictable Growth: Enables forecasting and strategy refinement with measurable impact.
- Accountability & Transparency: Data-driven metrics promote ownership and cross-team alignment.
Successful Case Studies
- Spotify: Time Spent Listening as a Core KPI
Spotify uses “Time Spent Listening” as its core engagement metric. This North Star metric reflects user satisfaction and helps steer product innovations such as curated playlists and seamless playback experiences. By optimising for this KPI, Spotify ensures users find value and remain loyal to the platform.
- Dropbox: Activation Events for Retention
Dropbox discovered that users who uploaded a file within an hour of sign-up were significantly more likely to become long-term users. This insight led to redesigning onboarding flows to guide users toward file upload quickly, resulting in a measurable retention boost.
- Airbnb: Booking Rate per Listing View
One important indicator that Airbnb noticed was “Booking per Listing View.” By analysing which listing characteristics led to higher conversions, they optimised search algorithms and photo quality guidelines, improving both user experience and host success rates.
- Notion: Feature-Level Adoption Metrics
Notion uses in-app event tracking to monitor how users adopt key features like templates, databases, or sharing tools. These insights help prioritize onboarding improvements and product tutorials, leading to stronger feature adoption and reduced churn.
Challenges and Considerations
While KPIs offer powerful guidance, missteps can lead to misleading conclusions or wasted effort. Common challenges include:
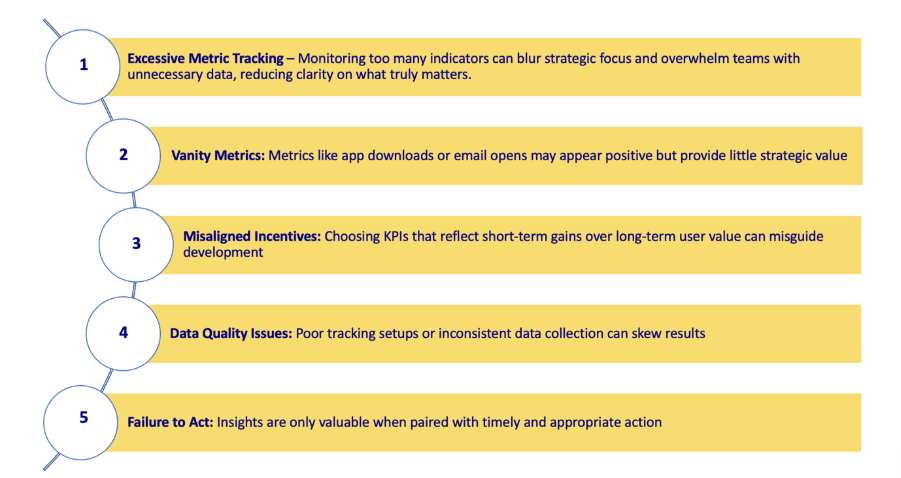
- Excessive Metric Tracking – Monitoring too many indicators can blur strategic focus and overwhelm teams with unnecessary data, reducing clarity on what truly matters.
- Vanity Metrics: Metrics like app downloads or email opens may appear positive but provide little strategic value.
- Misaligned Incentives: Choosing KPIs that reflect short-term gains over long-term user value can misguide development.
- Data Quality Issues: Poor tracking setups or inconsistent data collection can skew results.
- Failure to Act: Insights are only valuable when paired with timely and appropriate action.
Conclusion
KPIs are more than just numbers; they are a reflection of how well a product delivers on its promise. When selected carefully and aligned with business and user goals, KPIs become the compass that guides teams toward sustained success. To build impactful, user-centric products, organisations must go beyond intuition. With the right KPIs, teams can confidently navigate uncertainty, uncover growth opportunities, and iterate with purpose. Ultimately, the metrics that matter are those that connect effort to outcome and users to value.